Brisbane CBD Office Market Intelligence
Vacancy is the single most important number
in the Brisbane CBD office market. Caden IP
tracks every vacancy, in every building,
every month — no estimates, no gaps.
Request the Vacancy Tracker
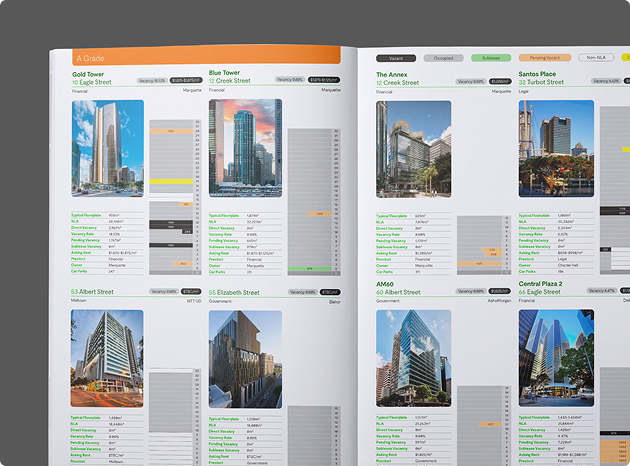
Caden IP's Brisbane CBD Vacancy Tracker
No-one else in Brisbane tracks the CBD with this level of precision.
Caden is Brisbane CBD’s only independent office leasing specialist tracking suite-level vacancy — published monthly since 2019, trusted by landlords and tenants, and unavailable anywhere else. Request the Vacancy Tracker.
Verified
Every vacancy is recorded with its exact floor area (NLA) and availability date and confirmed each month with the landlord [or managing agent]. When Heads of Agreements are signed, the space is withdrawn.
Primary
Caden Office Leasing collects the data itself. None of it is licensed, aggregated or modelled from third-party sources. It comes from our own leasing activity and direct contact with landlords, and it is the same information we use to advise clients every day.
Data
More than six years of continuous monthly records since 2019. Vacancy can be analysed by building, grade, precinct and size, and compared across any period. The tracker shows how much space is available, where it sits and how the market has moved, without relying on estimates.
Vacancy Per Grade
Face Rent by Grade
Vacancy by Precinct for September 2026
Change on prior month

- Retail 14.14% 0.88%
- Transit 9.20% 0.37%
- Financial 8.53% 1.15%
- Midtown 6.84% 0.49%
- Legal 5.07% 0.00%
- Government 4.99% 0.00%
Market Summary
Every number on this page was collected, not estimated. Verified. Primary. Ours.
Request the Vacancy Tracker